
The key question to answer here is: What is the most effective Human Capital Strategy for your organization? How can you know if your company is improving the performance of its human capital? How can you know if your company is managing its human capital more effectively than its competitors are?
The Human Capital Lagging Indicator
Is there a single measure that concludes human capital improves year- over-year? Or, should we judge the efficiency of a human capital strategy by measuring changes in each of a set of key positions?
A 2007 McKinsey Quarterly article stated that the value of “intangible capital” of the world’s top 150 companies, as measured by market value less invested financial capital, increased from $800 billion in 1985 to $7.2 trillion in 2005.6 However, annual reports still focus on how a company uses its financial capital—not how it is growing its in- tangible values, the most important of which is human capital.
The McKinsey study examined the thirty largest companies in the world (by market capitalization) over the period 1995 to 2005. They found that the driver of a five-fold increase in profits was a doubling of profits per employee and number of employees. The Return on Invested Capital (ROIC) increased only by one-third during that same period. In other words, human capital measures were a much stronger predictor of market capitalization through profit growth than traditional measures such as ROIC. The world has changed. Effective human capital management, rather than financial capital management, is the most important driver of business value. Here is the equation for predicting profit growth and eventually market capitalization increases:
Profit per Employee X Number of Employees
You need a high profit per employee and lots of employees. This equation held true for companies like WalMart, with lots of employees and low profit per employee, and for Microsoft, with few employees and high profits per employee. The equation is not perfect, but it’s pretty robust and very simple.
Any company can measure its year-over-year change in human cap- ital by applying this formula to answer the question “Are we managing our human capital more effectively than last year?” Companies can also compare the effectiveness of their human capital with those in similar competitor companies. This requires that the companies are identical. Perhaps a better measure is year-over-year performance changes between industry competitors.
Human Capital Leading Indicators
What if you knew the most important things to do for your organiza- tion to grow its profit per employee and market cap? You have a vision and strategy that you can show, statistically, is the best model for your organization. This is possible and requires only simple statistics—the stuff you learned in Statistics 101.
Here is how it works. We’ve made an assumption that four strategic components are both necessary and sufficient for delivering the human capital vision. Thus, if an organization scores well on all four, it will have a sustained competitive advantage. However, whether these four truly matter to your organization’s business results is still an educated guess. Let’s turn gut level feelings into facts.
Building the optimal Human Capital Strategy for your organization requires systematically tracking performance over time and isolating relationships between lagging indicators (e.g., revenue growth, profit, customer satisfaction) and leading indicators (i.e., the four strategic components). This requires a basic regression equation between each of the four strategic objectives and one or more lagging indicators. The result will tell you the relative impact on profit per employee of each of the four strategic components. (See Figure 2-4.) 

Scores for each of the four strategic components are regressed on profit per employee. Remember, this is illustrative—it’s not real data. If this were real data, key position excellence would be the strongest driver of operating profits because it has the biggest correlation coefficient (r = .56), followed by effective executive teams (r = .44) and workforce performance (r = .42). The bigger the correlation coefficient (r), the more impact the strategic component has on profit. In this ex- ample, key position excellence has eight times more impact on profit than leaders who deliver results (i.e., .56 is eight times more than .07). If we want changes in profit per employee, we would be wise to make bigger investments in key position excellence than in leadership development. (Again, remember that this is not real data.)
If this data appeared in your organization, you might conclude that leadership performance (r = .07) is not related to profits. This might be because in your organization, leadership really isn’t that important. Alternatively, it might indicate that you chose the wrong leadership roles or the wrong leadership results, or that the results were inaccurately measured. Any of these hypotheses can be easily tested if you have the kind of data recommended throughout this book.
You might wonder, “What if there are other important strategic components we should have measured but didn’t?” Let’s say the top team chooses these four components to begin, but they also feel that “across-the-board skills” might be a good predictor—they’re just not sure. The team might choose to add the new measure “skills” to the model as a test component and analyze it behind the scenes. Let’s say that regressing “across-the-board skills” produces a coefficient of .62. That would mean that compared to the other four components, improving across-the-board skill levels was the most important thing to get right to improve profits. The team may then choose to eliminate leadership as a strategic component and add across-the-board skills. (See Figure 2-5.)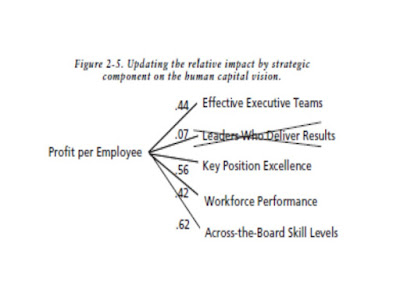

By capturing and analyzing data over time, your organization can estimate the financial impact of performance changes on each of the strategic components and make better informed investment decisions. Remember that y = ax + b equation from Statistics 101 that you swore you would never use? You need it now. Plug in x as the leading indicator and out pops y as the estimated value of the lagging indicator. “If we improve key position performance by x percent, we will increase profits by y percent.” It’s really no different from using retirement calculators where changing the leading indicators (e.g., years to retirement, money saved per year, percent annual investment increases) changes the number of work years left—the lagging indicator. Any graduate student in statistics can do this work for you.
Source : Bradley W Hall, PhD. The new human capital strategy : improving the value of your most important investment—year after year. AMACOM. 2008
No comments:
Post a Comment